Statistics
The following charts and graphs provide a high-level view of statistics for small businesses from 2014 to 2018. You can use these resources to quickly see a comparison of injury rates and serious injuries, and to get information on the top injury types for small businesses.
- Injury rate
- Serious injury claims
- Claim characteristics
- More detailed data
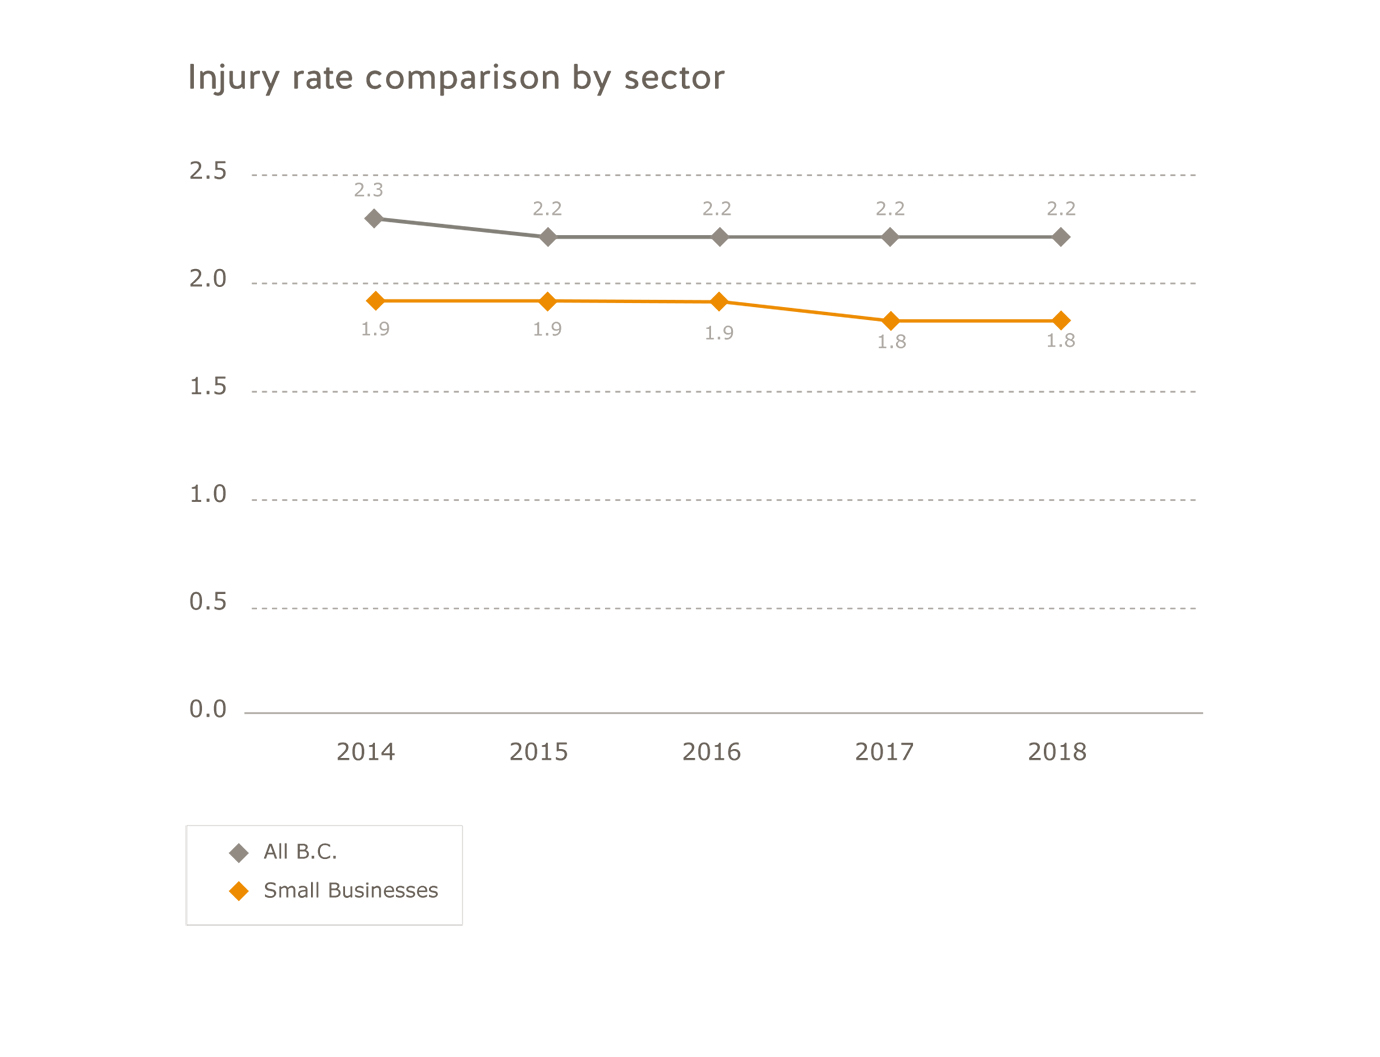
Injury rate
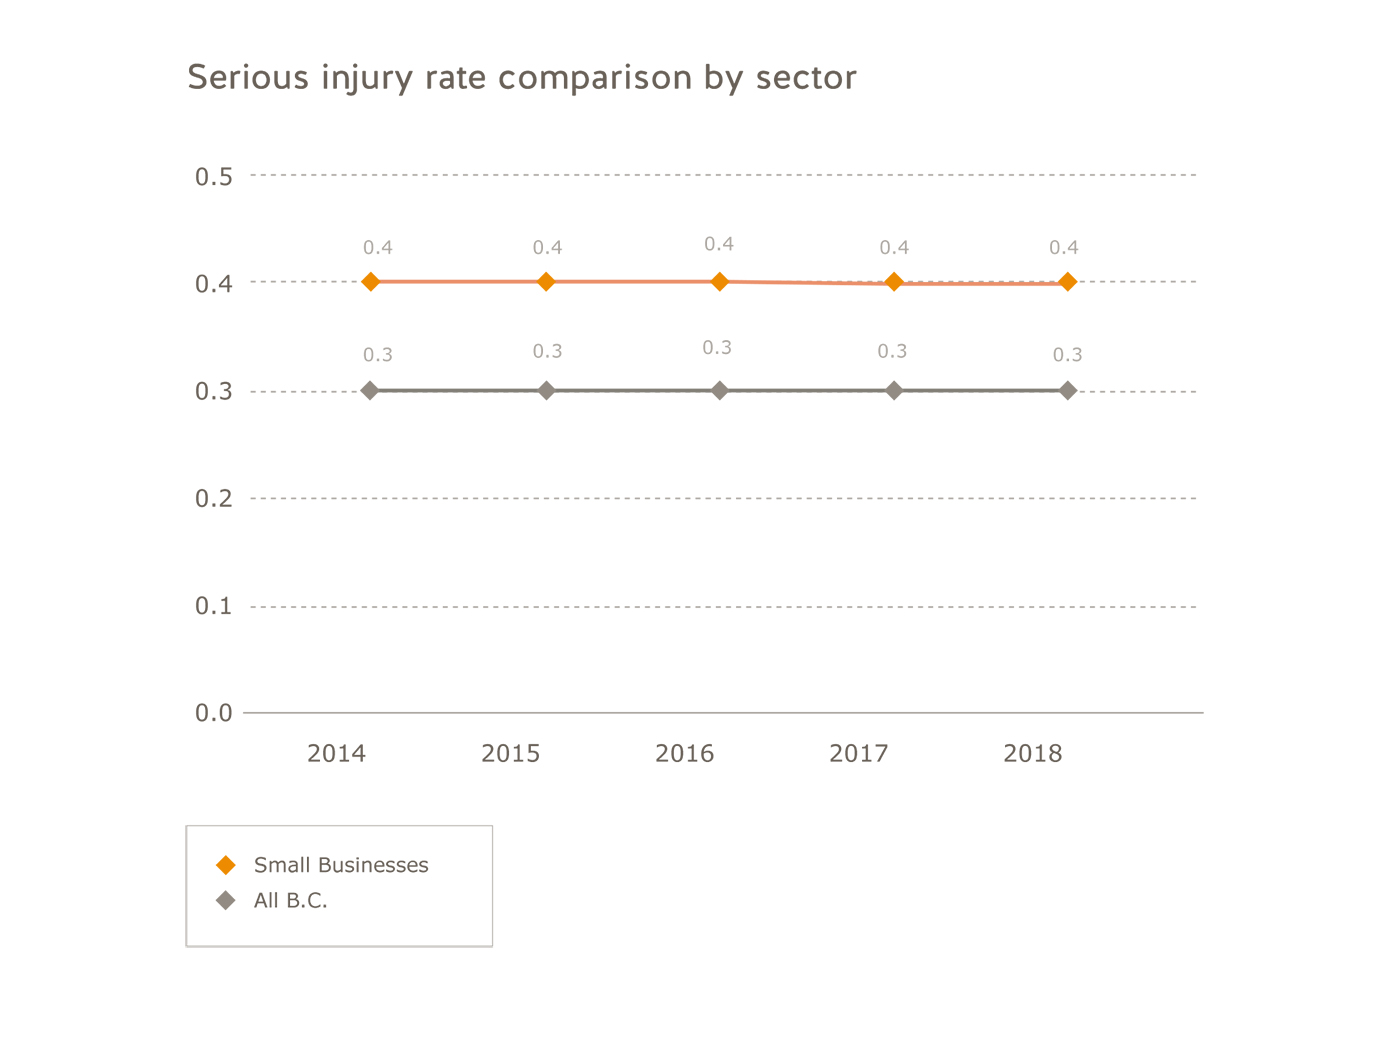
The following charts illustrate how many claims and serious injury claims small businesses have for every 100 workers, and the change in this rate over the most recent five-year period. The ultimate target is to have an injury rate of zero.
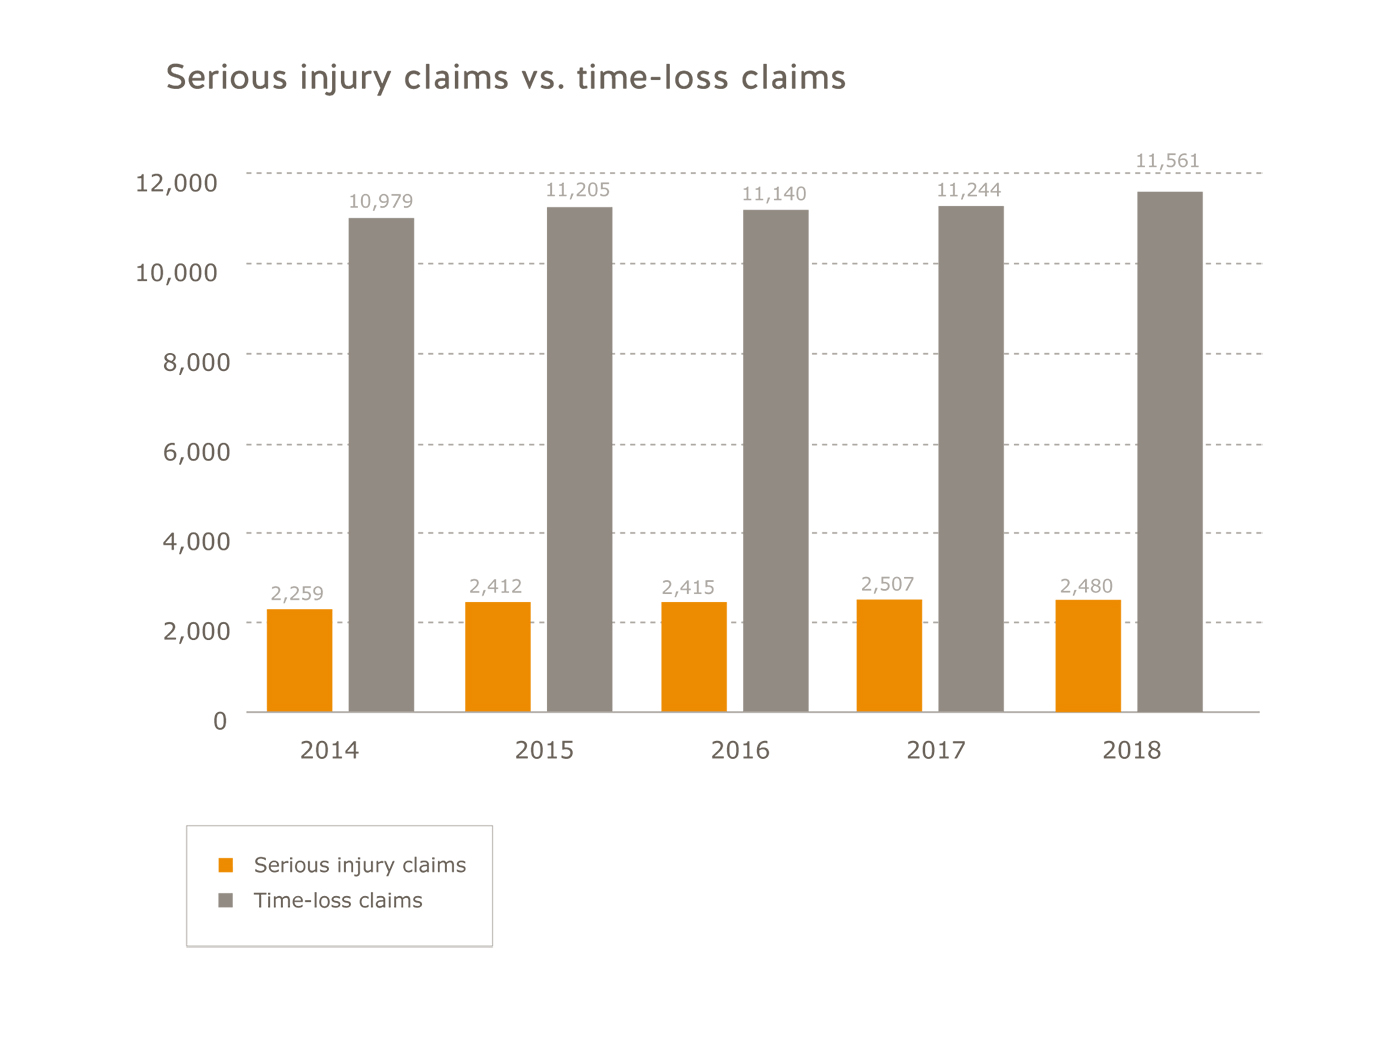
Serious injury claims
For more on serious injuries, see the Serious injuries: Data about workplace injuries in B.C.
Claim characteristics
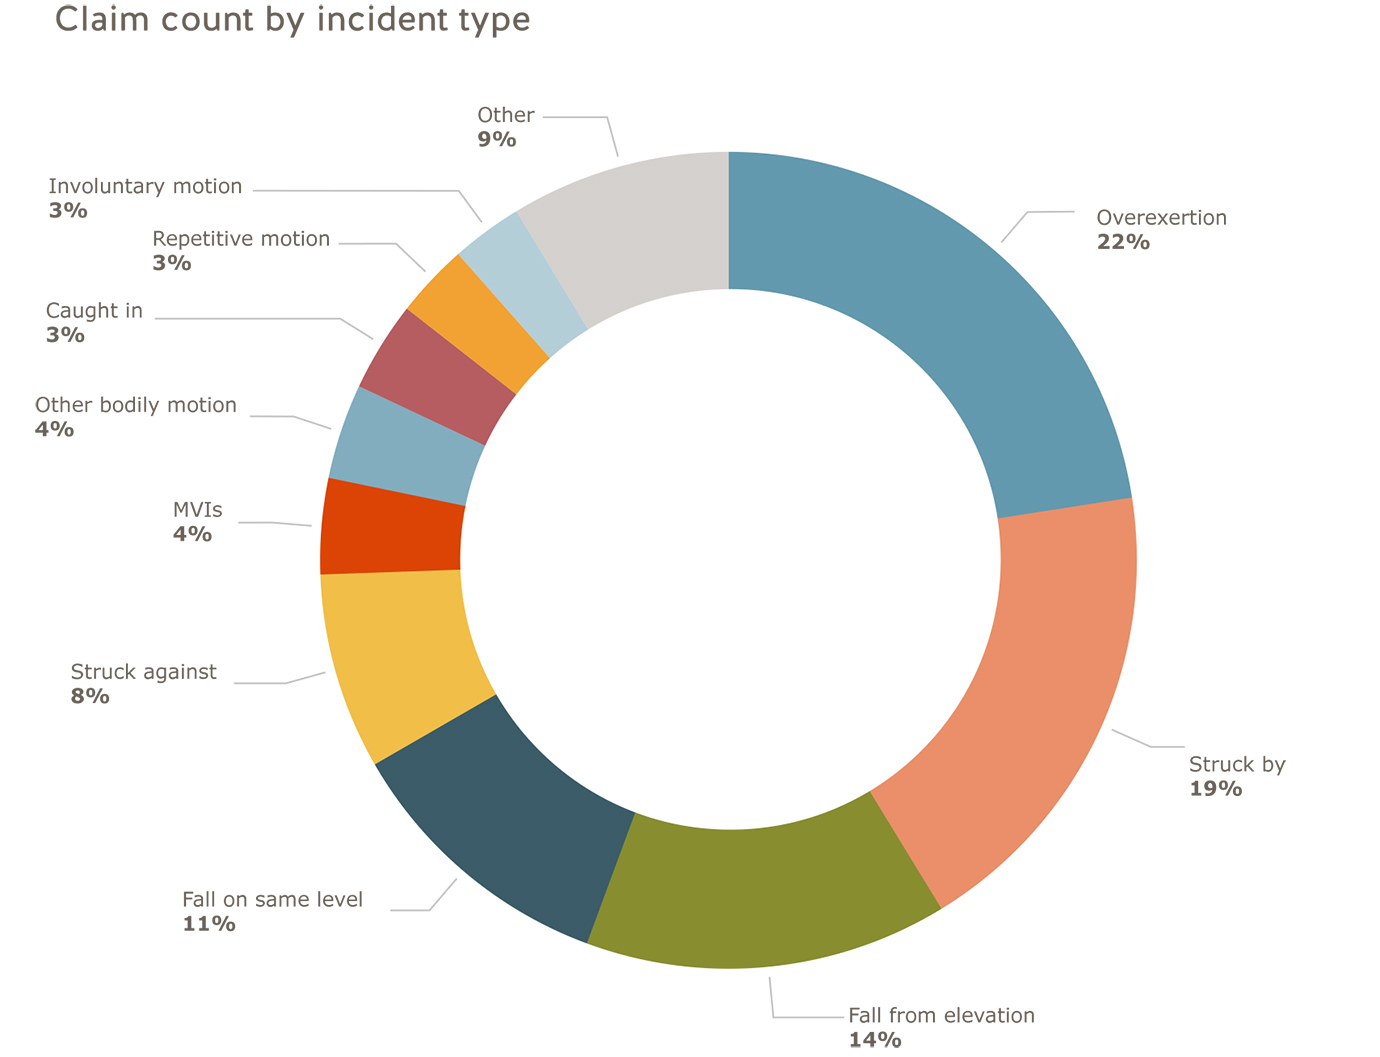
Incident type
The following charts illustrate the leading causes of injuries for small businesses over a five-year period. Incident types that represent a high percentage of claims for small businesses are potential focus areas for health and safety programs.
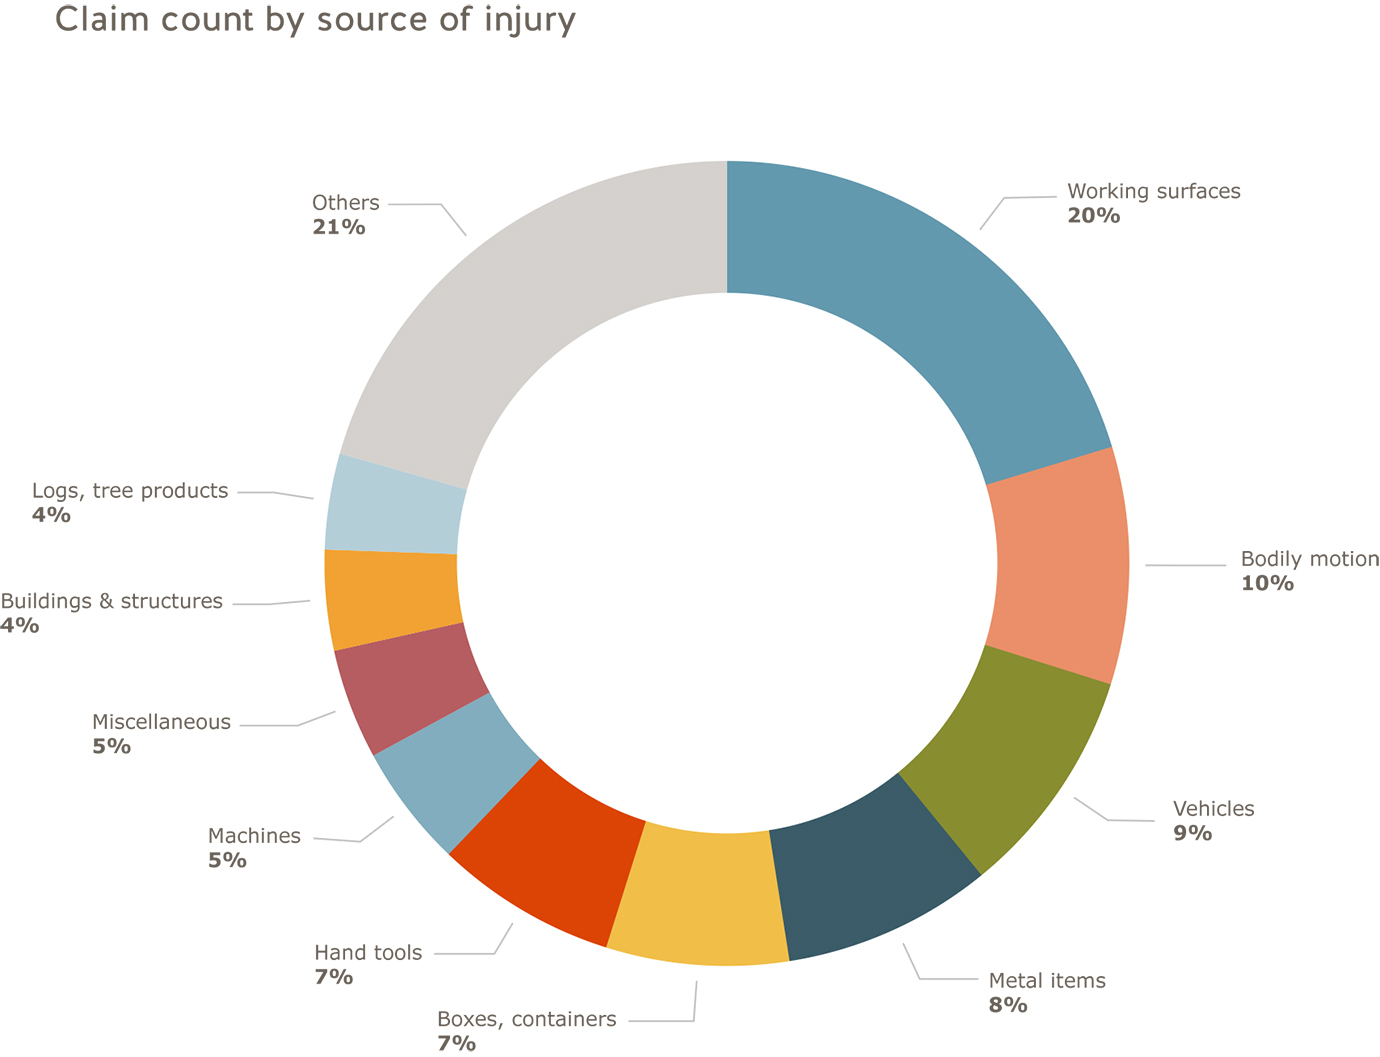
Sources of injury
The following charts illustrate the leading sources of injury over a five-year period. Sources of injuries contributing to a high percentage of claims or claim costs paid by small businesses are potential focus areas for health and safety.
More detailed data
The following applications can provide more detailed information:
- Provincial overview shows injury rates, claim costs and types, payroll, assessment rates, and injury management patterns in each industry over the past years.
- Industry claims analysis: Time-loss claims in B.C. takes an in-depth look at the types of work-related injuries and claims that are driving costs in your industry.
Both of these applications allow you to focus your search by industry, subsector, classification unit, and employer size to see data most relevant to you. You can also incorporate charts, graphs, and data in your reports and presentations.